Debugging tests
Learning objectives
-
Fixing problems in your test
-
Finding the cause of a failing test
-
Applying familiar debugging techniques to tests
-
Using Jasmine debugging features
Writing tests is as arduous as writing implementation code. You will be stuck quite often and ask yourself why the test fails – and sometimes why the test passes when it should rather fail.
The good news is that you can apply familiar debugging techniques to tests as well.
Test focus
Some tests require an extensive Arrange phase, the Act phase calls several methods or simulates complex user input. These tests are hard to debug.
| Isolate the problem |
When locating an error, narrow down the scope gradually: Execute only one test, one suite, one spec, one expectation.
Per default, Karma and Jasmine compile and run all specs again with every code change. This leads to a slow feedback cycle when you work on a particular spec. After a code change, it may take 10-20 seconds before you see the test result. Also one spec might interfere with another spec.
The easiest way to narrow down the scope is to set a focus on a suite or spec. Let us assume you have a test suite with two specs:
describe('Example spec', () => {
  it('one spec', () => { /* … */ });
  it('another spec', () => { /* … */ });
});
fdescribe
|
If you want Jasmine to run only this test suite and skip all others, change describe to fdescribe:
fdescribe('Example spec', () => {
  it('one spec', () => { /* … */ });
  it('another spec', () => { /* … */ });
});
fit
|
If you want Jasmine to run only one spec, change it to fit:
describe('Example spec', () => {
  fit('one spec', () => { /* … */ });
  it('another spec', () => { /* … */ });
});
This improves the developing experience tremendously.
The Webpack module bundler still re-emits the whole bundle even if you have only changed one line of code and even if there is a test focus on one suite.
| Bundle one file |
In this case, you can instruct ng test to consider only the file you are currently working on. Webpack then includes all its dependencies, like the Angular framework, but not more.
For example, to include only tests called counter.component.spec.ts, we call ng test with the --include option.
ng test --include **/counter.component.spec.ts**/counter.component.spec.ts means all files called counter.component.spec.ts in any subdirectory.
The bundling is now fast and the feedback is almost instant when we change implementation or test code.
Keep in mind to remove the test focus before committing your code. There are several tools that prevent fdescribe and fit from being committed.
Developer tools
The Jasmine test runner is just another web page made with HTML, CSS and JavaScript. This means you can debug it in the browser using the developer tools.
| Familiar debugging tools |
Focus the browser window and open the developer tools. In Chrome, Firefox and Edge, you can use the F12 key.
You can use the developer tools to:
-
Write debug output to the console using
console.log,console.debugand friends. -
Use the JavaScript debugger. You can either set breakpoints in the developer tools or place a
debuggerstatement. -
Inspect the DOM of rendered Components.
Debug output and the JavaScript debugger
The most primitive tool, console.log, is in fact invaluable when debugging tests. You can place debug output both in the test code and the implementation code.
Versatile console.log
|
Use debug output to answer these questions:
-
Is the test, suite, spec run at all?
-
Does the test execution reach the log command?
-
Did the test call the class, method, function under test correctly?
-
Are callbacks called correctly? Do Promises complete or fail? Do Observables emit, complete or error?
-
For Component tests:
-
Is Input data passed correctly?
-
Are the lifecycle methods called correctly?
debugger
|
Some people prefer to use debugger instead of console output.
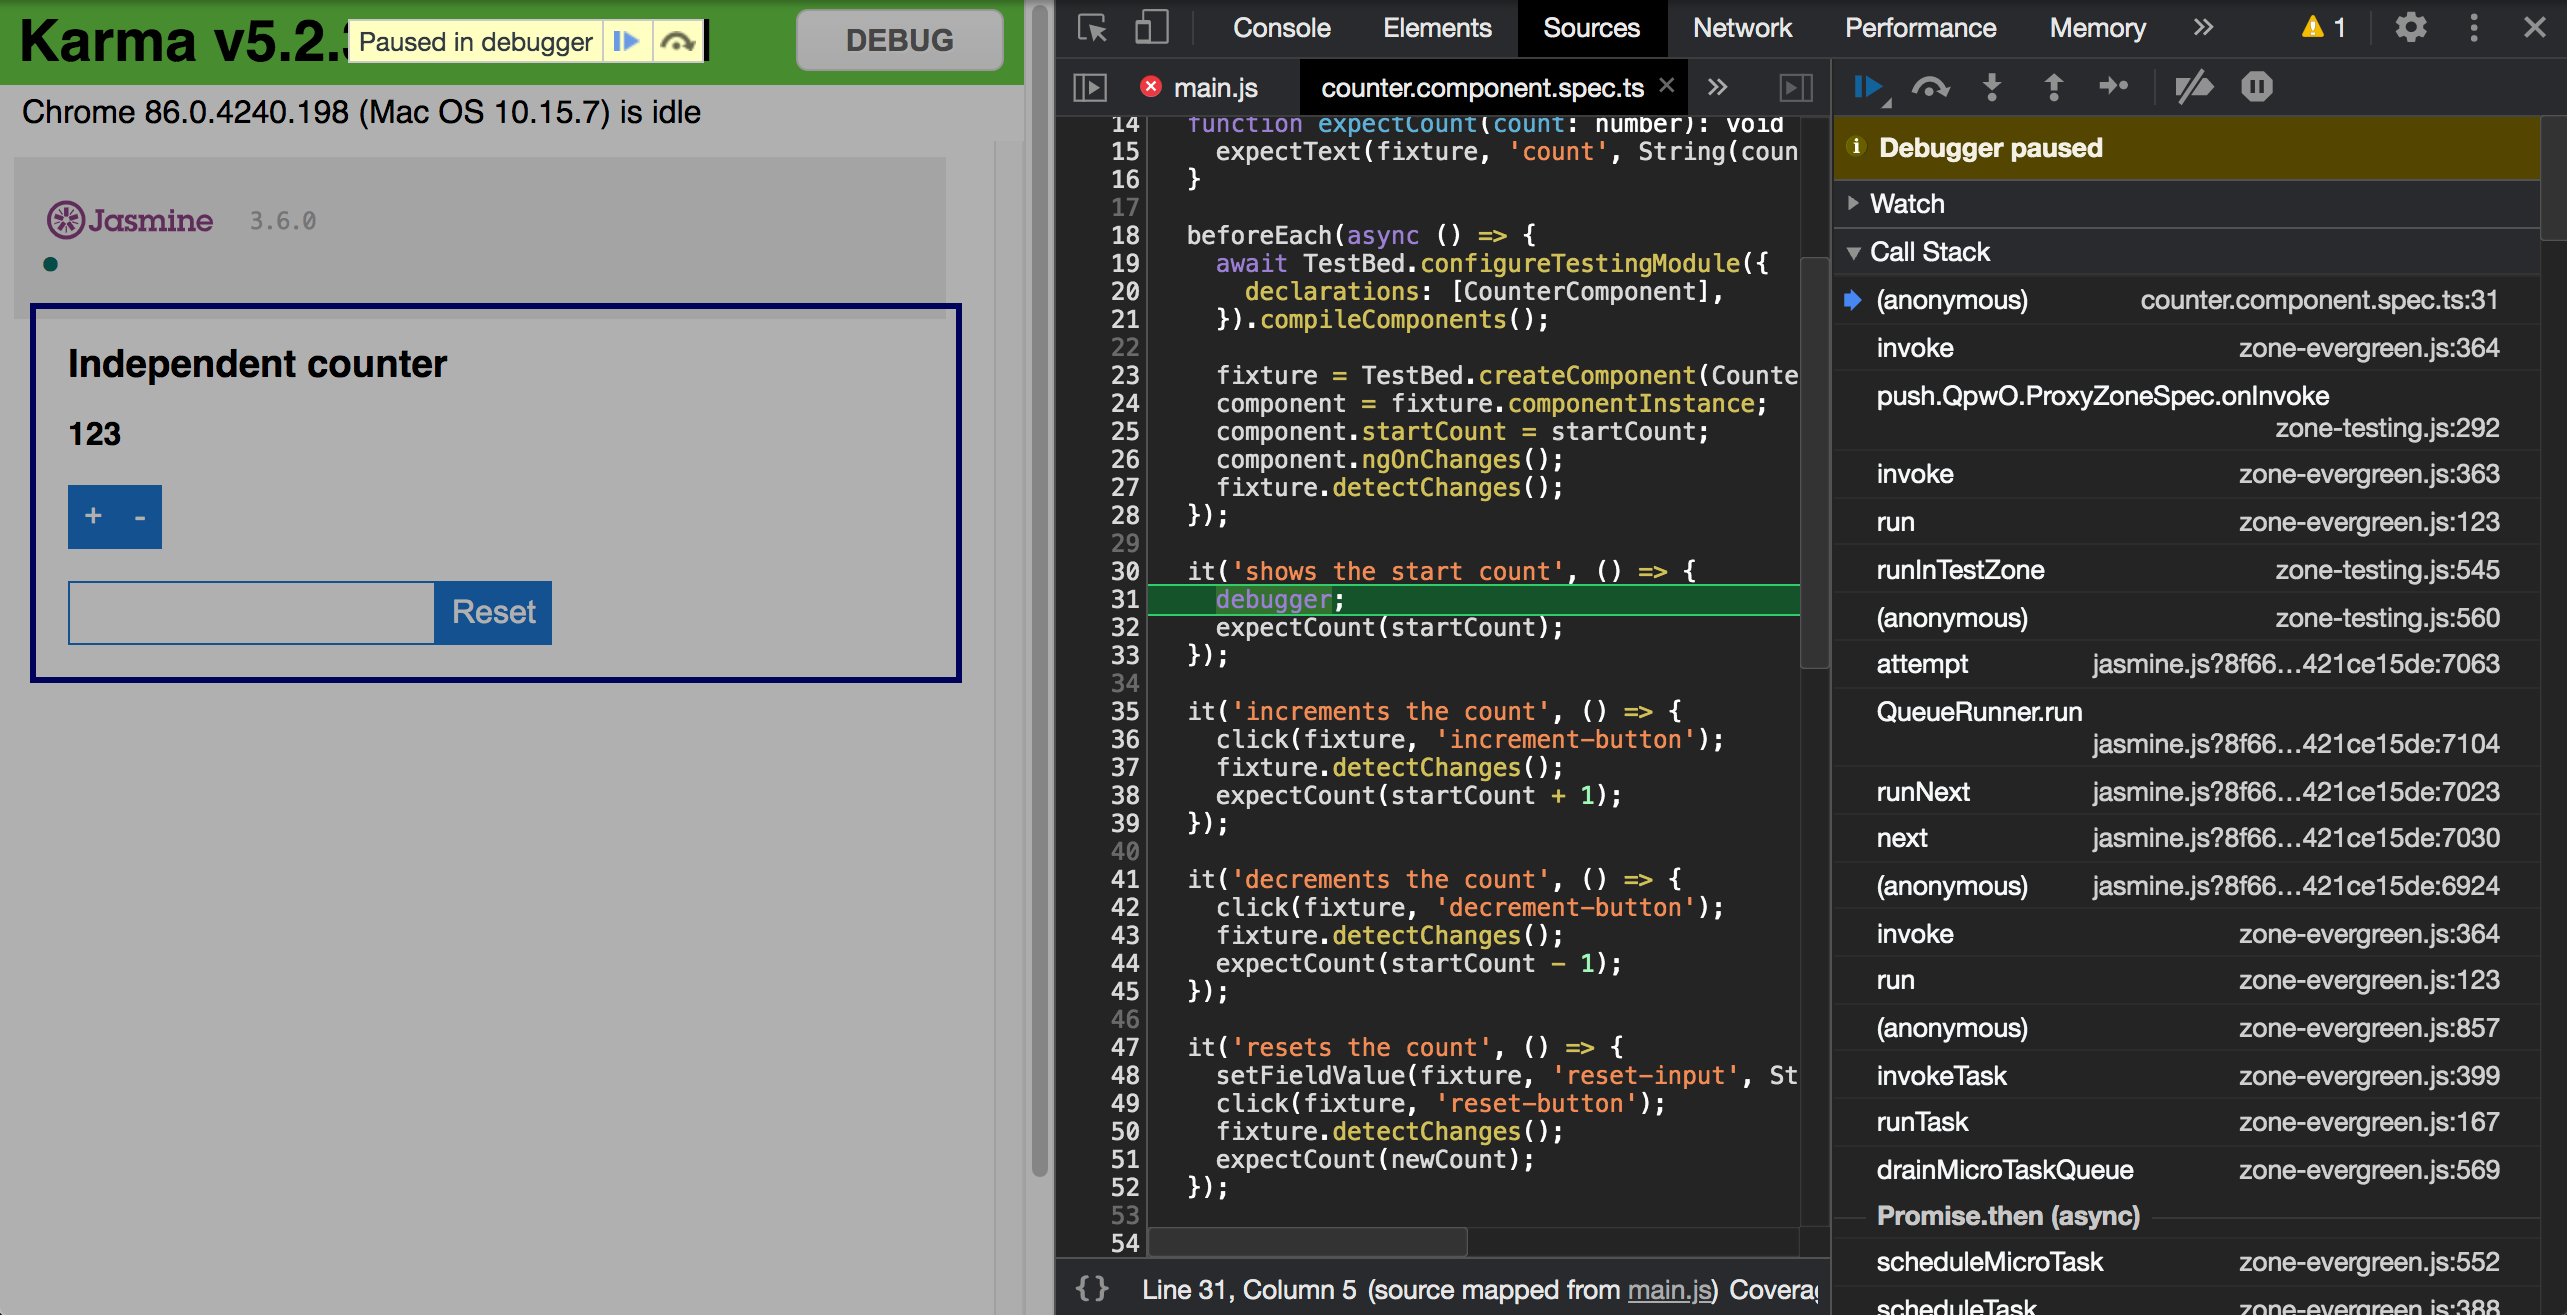
While the debugger certainly gives you more control, it halts the JavaScript execution. It may disturb the processing of asynchronous JavaScript tasks and the order of execution.
| Async logging |
The console methods have their own pitfalls. For performance reasons, browsers do not write the output to the console synchronously, but asynchronously.
If you output a complex object with console.log(object), most browsers render an interactive representation of the object on the console. You can click on the object to inspect its properties.
const exampleObject = { name: 'Usagi Tsukino' };
console.log(exampleObject);
It is important to know that the rendering happens asynchronously. If you change the object shortly after, you might see the changed object, not the object at the time of the console.log call.
const exampleObject = { name: 'Usagi Tsukino' };
console.log(exampleObject);
exampleObject.name = 'Sailor Moon';
On the console, the object representation may show name: 'Sailor Moon' instead of name: 'Usagi Tsukino'.
One way to prevent this confusion is to create a snapshot of the object. You convert the object to a JSON string:
const exampleObject = { name: 'Usagi Tsukino' };
console.log(JSON.stringify(exampleObject, null, '  '));
exampleObject.name = 'Sailor Moon';| Log a snapshot |
If you want an interactive representation on the console, create a copy of the object with JSON.stringify followed by JSON.parse:
const exampleObject = { name: 'Usagi Tsukino' };
console.log(JSON.parse(JSON.stringify(exampleObject)));
exampleObject.name = 'Sailor Moon';
Obviously, this only works for objects that can be serialized as JSON.
Inspect the DOM
In the next chapter, we will learn how to test Components. These tests will render the Component into the DOM of the Jasmine test runner page. This means you can briefly see the states of the rendered Component in the browser.
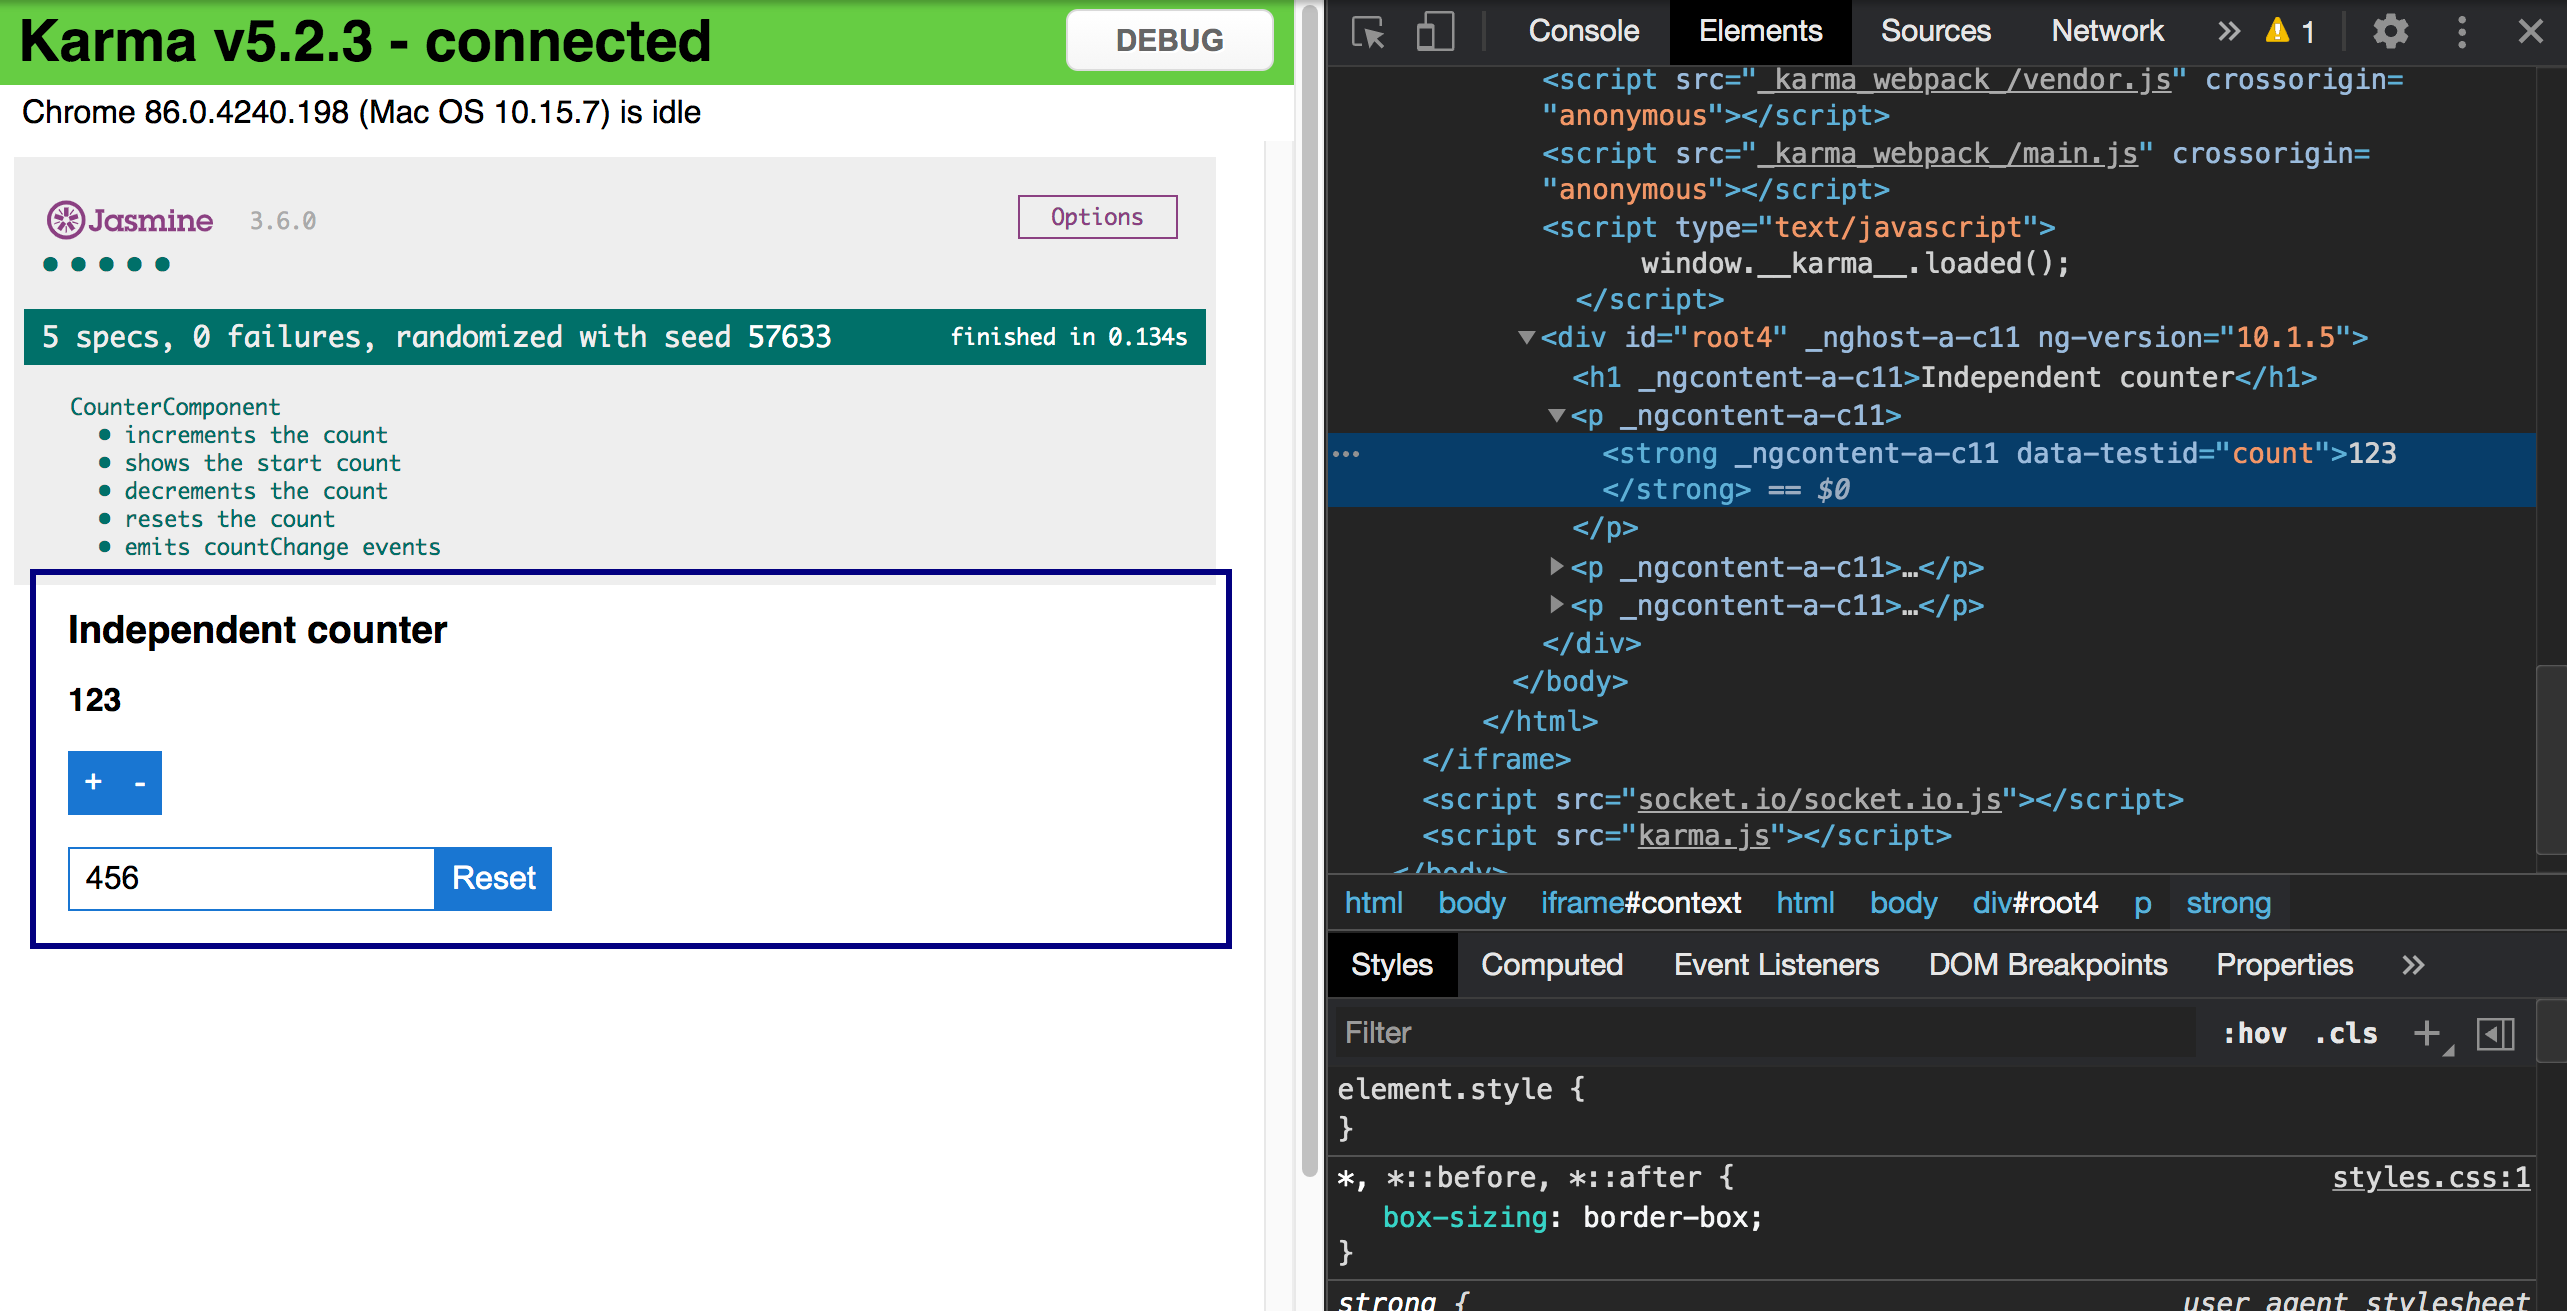
In the screenshot above, you see the rendered Component on the left side and the inspected DOM on the right side.
| Root element |
The Component’s root element is rendered into the last element in the document, below the Jasmine reporter output. Make sure to set a focus on a single spec to see the rendered Component.
The rendered Component is interactive. For example, you can click on buttons and the click handlers will be called. But as we will learn later, there is no automatic change detection in the testing environment. So you might not see the effect of the interaction.
Jasmine debug runner
The Karma page at http://localhost:9876 loads an iframe with the actual Jasmine instance, http://localhost:9876/context.html. This iframe complicates debugging because the developer tools operate on the topmost document per default.
In the developer tools, you can select the iframe window context (Chrome is pictured):
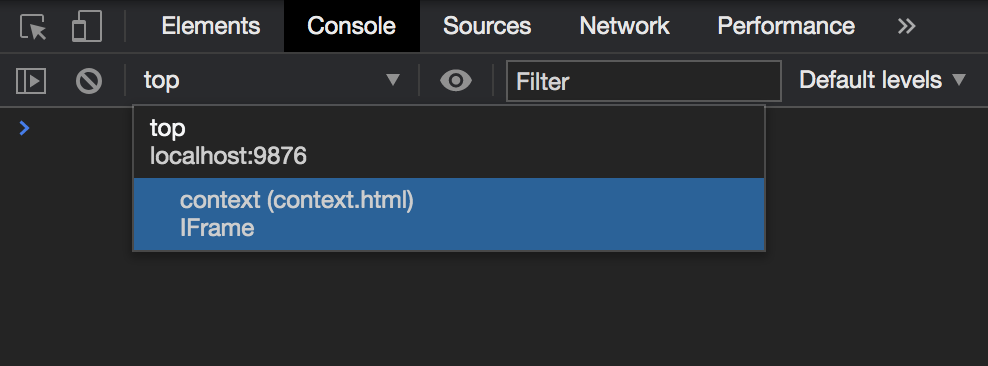
This way you can access global objects and the DOM of the document where the tests run.
| Debug runner without iframe |
Another helpful feature is Karma’s debug test runner. Click on the big “DEBUG” button on the top-right. Then a new tab opens with http://localhost:9876/debug.html.
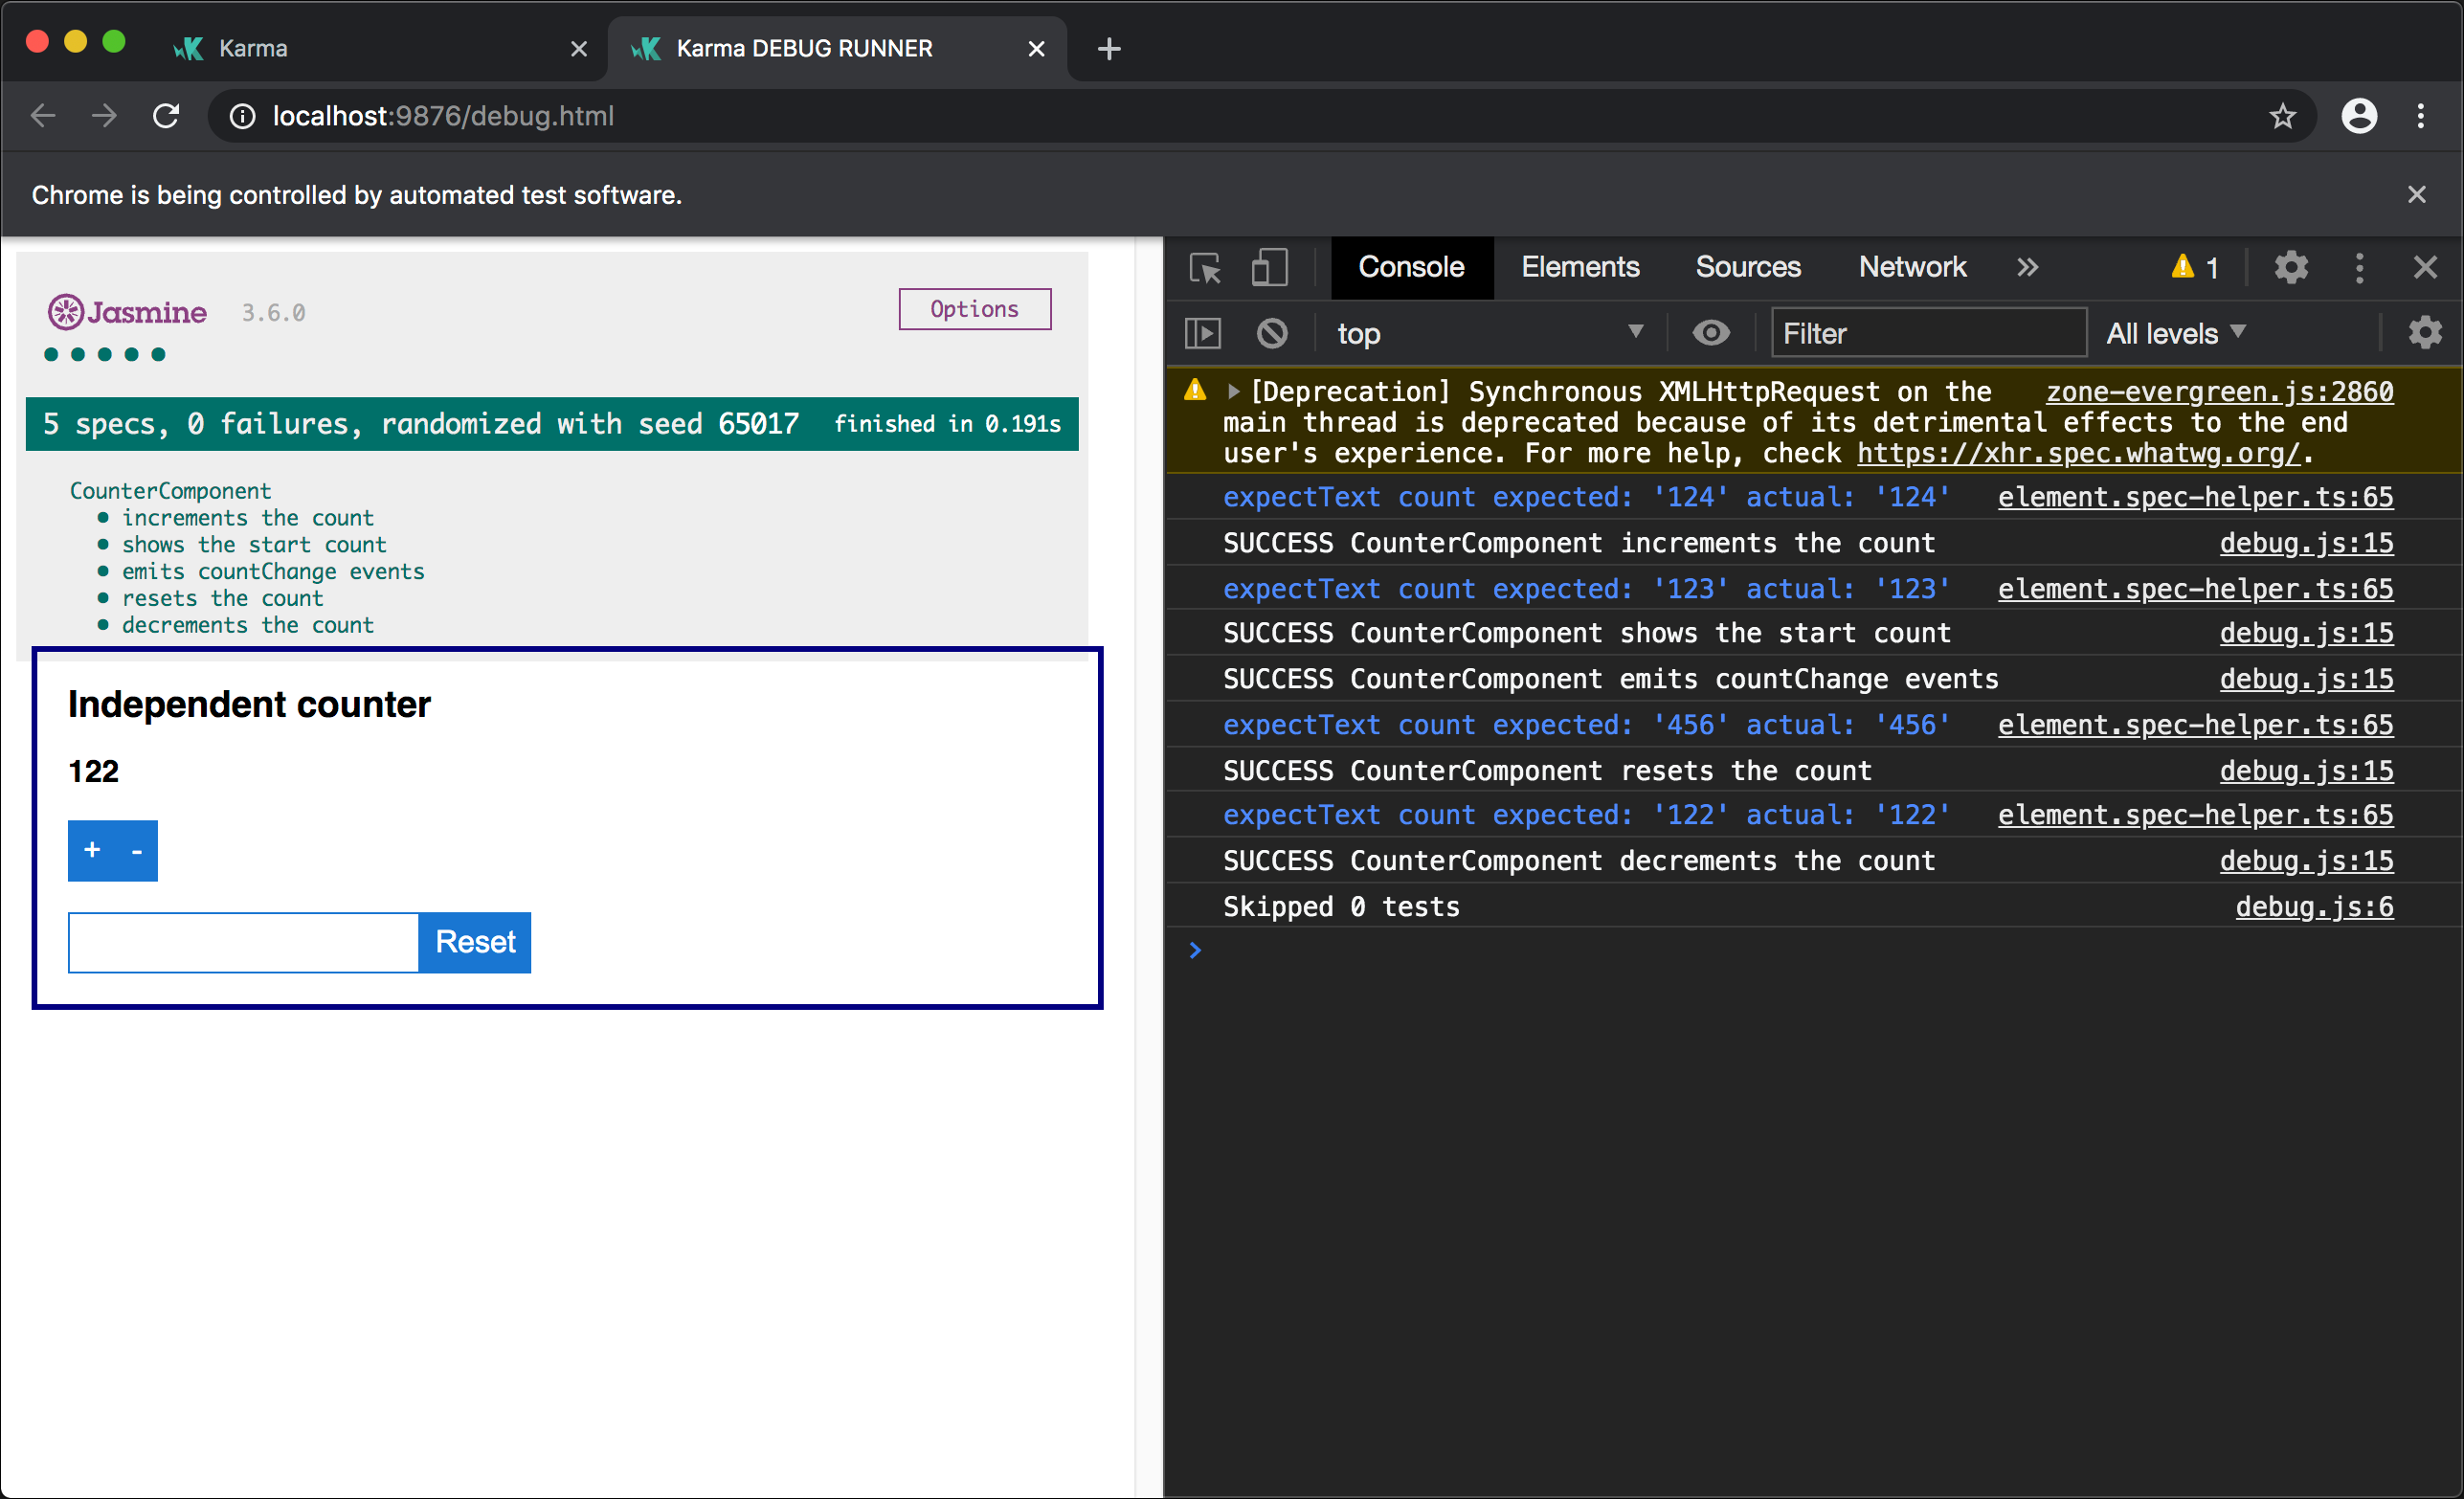
The debug test runner does not have an iframe, it loads Jasmine directly. Also it automatically logs spec runs on the shell.
If you change the test or implementation code, the debug runner does not re-run the tests. You have to reload the page manually.